%20%20-%20Menu.svg)








In this blog
A customer was hitting a 60-second timeout on /api/v1/<clickpost-api>. We pulled the ALB access logs. The request arrived, the front-facing ALB forwarded it to nginx on our Python server, and exactly 60 seconds later the customer got a 504. target_processing_time was -1.0. Nginx was healthy. Gunicorn was healthy. The downstream Kotlin service this endpoint routes to was healthy. Every individual component was fine.
The 60 seconds was happening on the wire.
A different alert told us another fleet was emitting thousands of customer-facing 502s per hour. Every nginx error log line was the same: recv() failed (104: Connection reset by peer) while reading response header from upstream. Gunicorn was sending RSTs to nginx. Gunicorn wasn't crashing. Workers weren't being killed. The RSTs were coming out of a fully healthy process, for reasons no application metric could explain.
Two stories. Two flavors of the same problem: real customer-facing latency happening between processes, below the layer any APM knows how to instrument. This post is about how we found them, and the eBPF network trackers we wrote to do it.
What this part is about
In Part 1 we looked at hidden latency inside the Python process: the gunicorn handoff queue, gen-2 GC pauses freezing sibling threads through the GIL, off-CPU stalls beneath the runtime.
In Part 2 we go below the process: TCP handshakes that quietly take 60 seconds against a stale IP, keep-alive connections being closed with unread data in the recv buffer (Linux's signature trigger for an RST), and connection-pool race conditions between the load balancer and the target.
What APM can and can't see (network edition)
APM (OpenTelemetry, Datadog, NewRelic) instruments HTTP clients in your application code. When your worker calls requests.post() or a Django ORM query crosses the wire, APM wraps the call and emits a span around it. This is enough when the slowness is in the call your library makes.
APM cannot see:
- Whether your TCP handshake to the upstream succeeded on the first try, or whether the kernel quietly retried for 60 seconds against a dead IP before giving up
- Whether the connection your library "successfully sent on" was actually intact, or whether the peer's kernel emitted an RST half a millisecond later
- Whether the load balancer in front of you closed a connection at the same microsecond it picked the same connection to forward a new request
- Whether the AWS hypervisor dropped a packet because your instance was over its baseline pps budget
- Whether the kernel retransmitted your packet seventeen times before declaring loss and stalling the connection for 200ms
All of this happens beneath the syscall boundary, in the kernel's networking stack. The application never knows. The span never includes it. The latency is real and the customer feels it.
So we built two trackers: ebpf_tcp_connect (outbound handshake observability) and ebpf_tcp_loss (kernel-emitted RSTs, retransmits, zero-window stalls). They run as kprobes inside the kernel, fire on every relevant networking event, and ship structured rows to ClickHouse where we can JOIN them against OpenTelemetry traces by (pid, tid, timestamp).
The connection chain
For the inside-the-Python-process view of every queue and buffer, see Part 1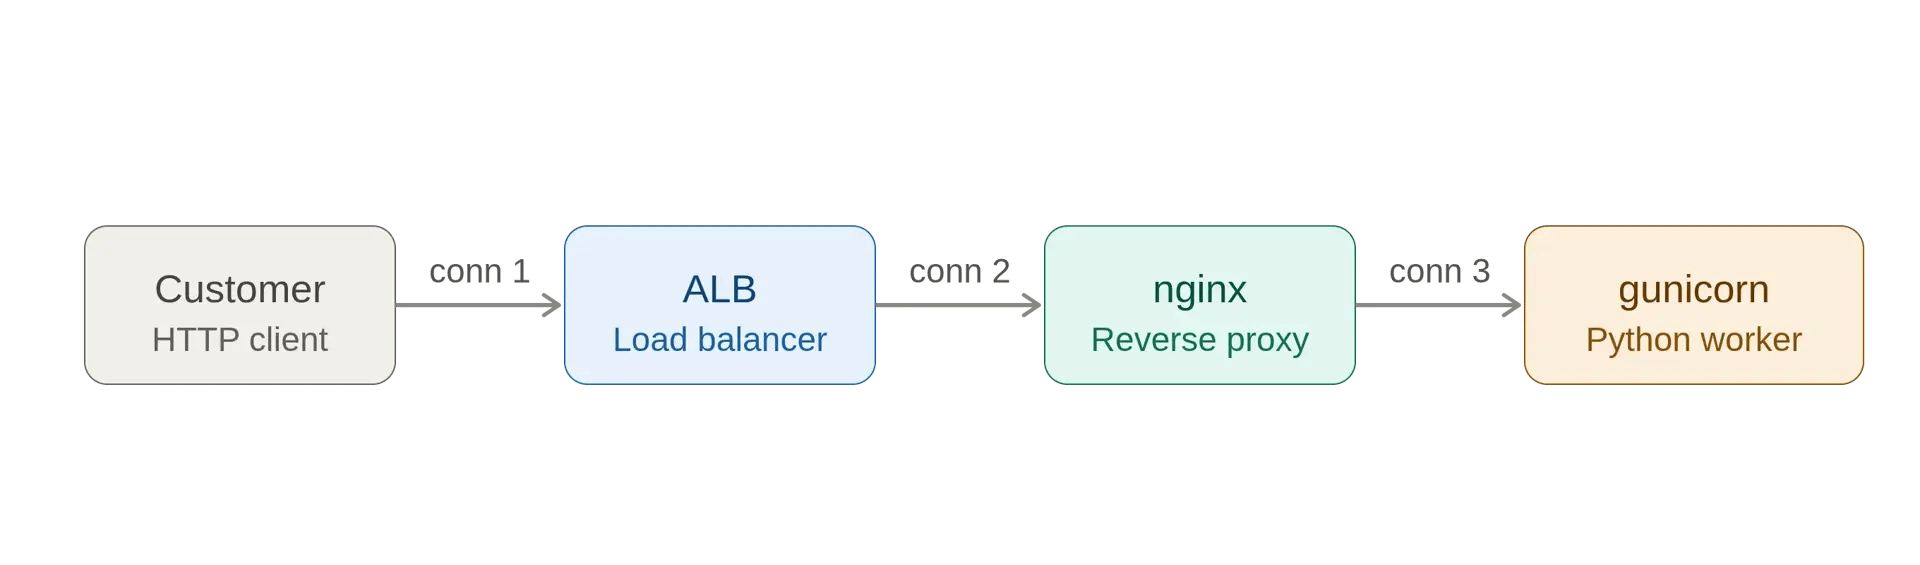
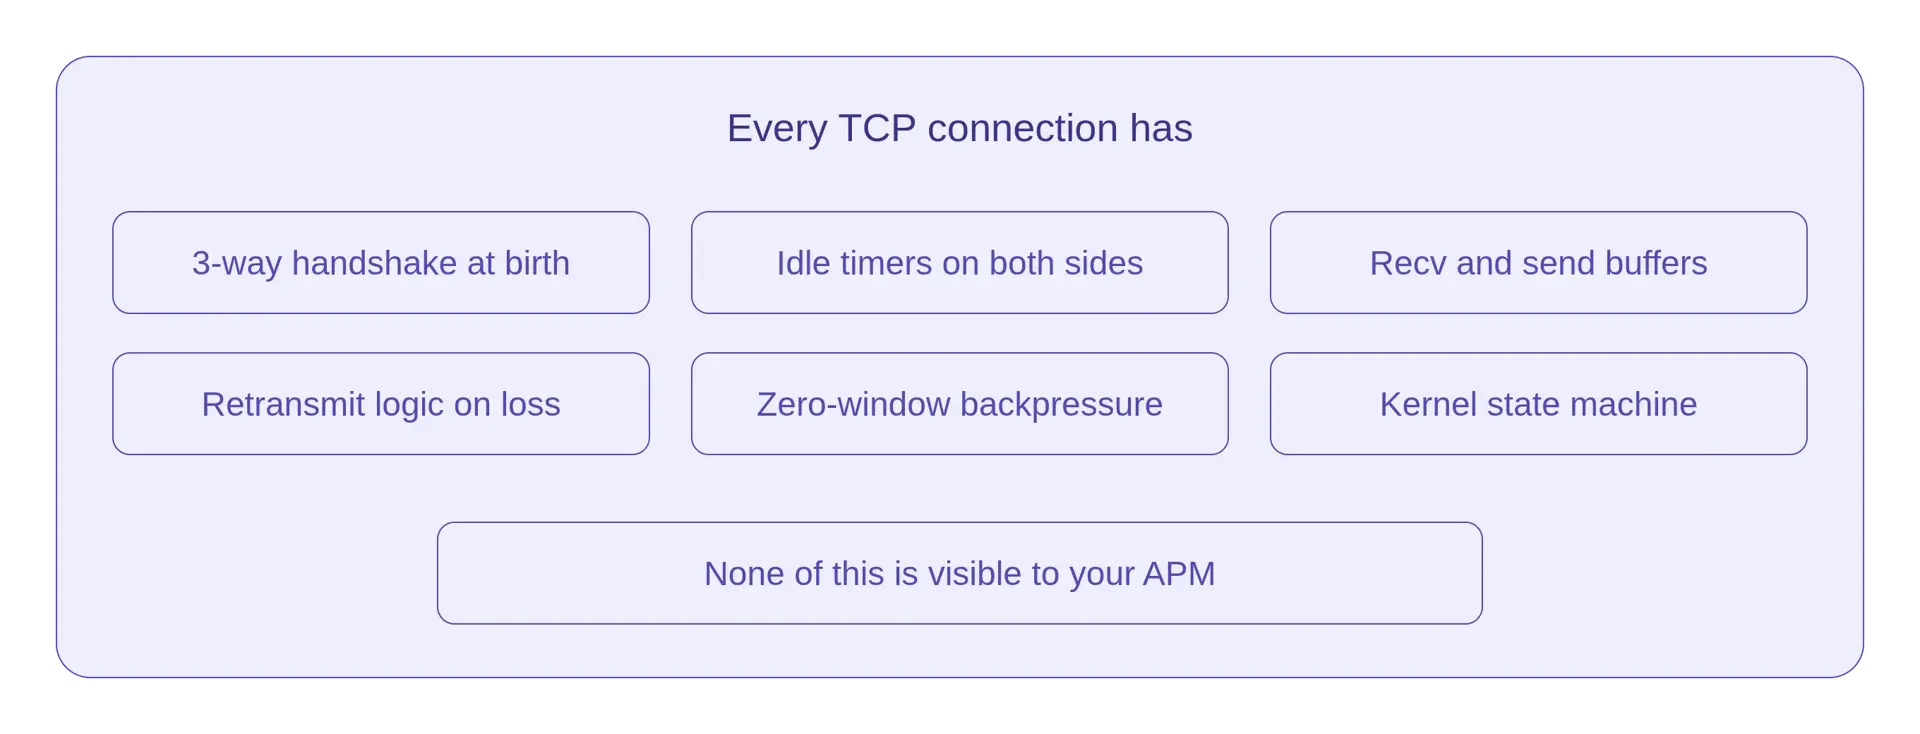
A customer request to our Python stack passes through more queues, buffers, and protocol state machines than any single observability tool exposes. Each arrow in the diagram is a TCP connection. Each connection has a 3-way handshake at birth, idle timers governing when it dies, retransmit logic when packets are lost, recv/send buffers between the kernel and userspace, and a state machine the kernel tracks. None of this is in your handler. All of it can hurt your latency.
The two stories below took us through different layers of this stack.
Story one: the 60-second nginx hold
Our main API runs on a Python fleet behind nginx. A while back, for latency-critical endpoints, we migrated a handful of routes to a separate Kotlin service, while leaving everything else on Python. So nginx, in front of gunicorn, also acts as a router: most requests go to the local Python app, but for a few endpoint prefixes, nginx forwards to an internal ALB that fronts the Kotlin fleet.
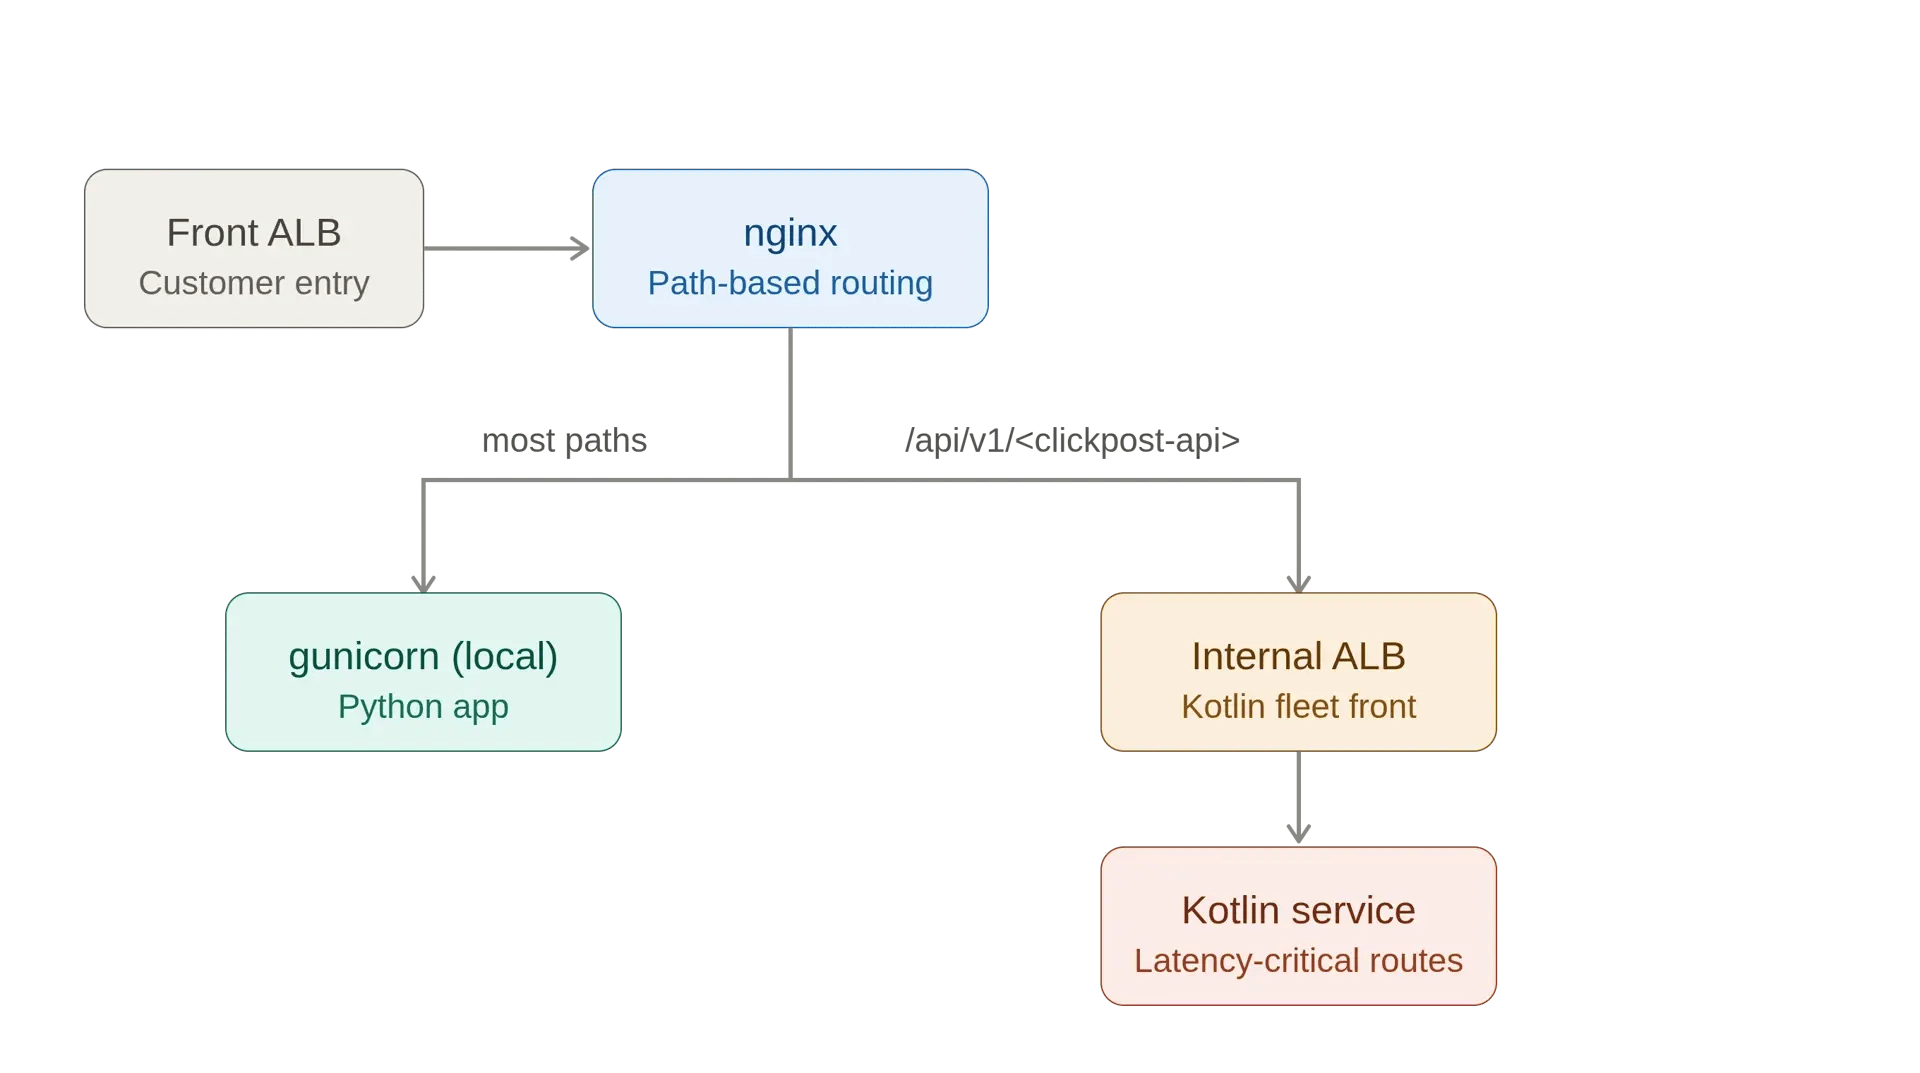
The customer's alert said /api/v1/<clickpost-api>, one of the migrated Kotlin routes, was timing out at 60 seconds. We pulled OpenTelemetry. p99 latency on the endpoint was under a second. The handler was fast. The customer was right anyway.
The front-facing ALB access logs showed the request arriving at nginx with target_processing_time = -1.0. That dash means the ALB sent the request to nginx but never received a response back, and gave up at its idle timeout. Customer saw 504.
We checked nginx, gunicorn, Kotlin. All healthy. Whatever nginx was doing during those 60 seconds was something it wasn't logging.
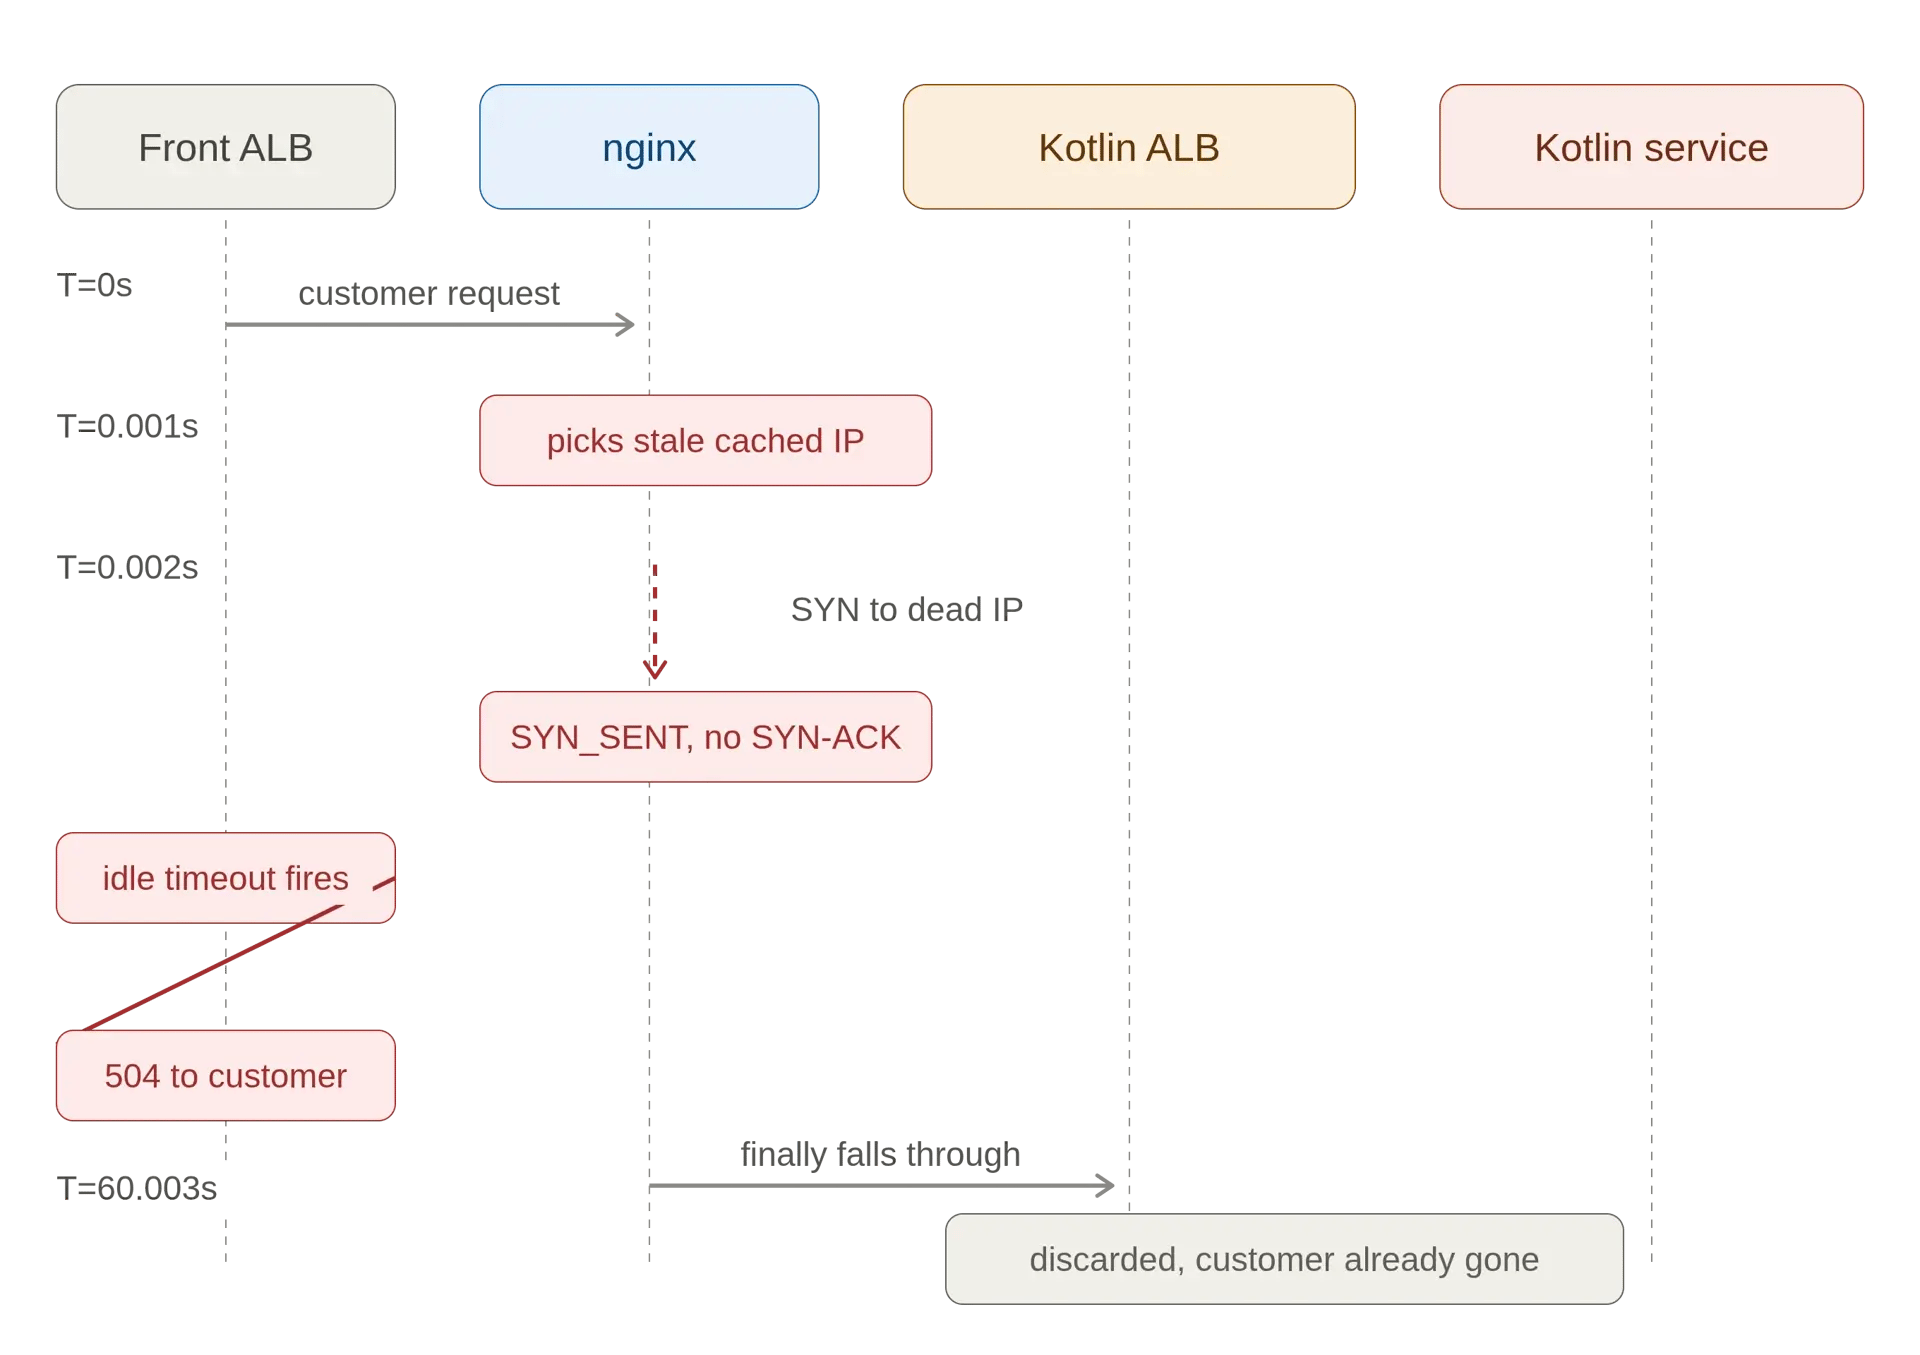
To narrow it down, we cross-joined the two ALB access logs (the front ALB and the internal Kotlin ALB) in Athena on request_id. The pattern was exact: for every failed request, ALB-1 received the request, and ALB-2 received the same request exactly 60003 milliseconds later. nginx was holding the request for a full minute before forwarding it to the Kotlin ALB. The front ALB had already timed out and returned 504 to the customer by the time the Kotlin ALB even saw the request, which is why ALB-2 logged a strange 460 status (its connection upstream had been torn down by the time it tried to respond).
So nginx was doing nothing visible for 60 seconds, then forwarding the request. We pulled ebpf_tcp_connect for the nginx process on the affected boxes:
Three destination IPs came back. Two were healthy ALB IPs with sub-2ms handshakes. The third had every attempt with outcome=failure and handshake_us = 60000000. Sixty-second TCP handshake failures, repeating constantly
A SYN packet, stuck in SYN_SENT, waiting 60 seconds for a SYN-ACK that would never come, before the kernel gave up.
The third IP wasn't in DNS at all. It was an old ALB IP that AWS had rotated out days earlier.
The mechanism: nginx (standard, not nginx-plus) with upstream { server <hostname>; } resolves the hostname once at worker startup and caches the resulting IPs in worker memory forever. No re-resolution unless you reload nginx. AWS rotates ALB IPs based on traffic-driven autoscaling, AZ failover, and health replacement, with a 60-second DNS TTL. DNS was correct; nginx just wasn't looking at it.
Round-robin across nginx's cached IP list (now containing one dead IP and two live ones) meant roughly one in three requests for the migrated Kotlin routes tried the dead IP, sat in SYN_SENT for 60 seconds, and timed out. The front ALB's idle timeout fired at exactly the same 60 seconds, the customer got a 504, and a moment later nginx finally fell through to a live IP and forwarded the request to the Kotlin ALB, which then promptly discarded it because its connection back to the front had already been torn down.
Building the connect tracker
The eBPF tracker that exposed this is conceptually small. Every outbound TCP handshake the kernel performs goes through a known sequence:
-
The process calls connect(), which calls tcp_v4_connect() internally. The socket enters the SYN_SENT state.
-
If the peer responds with SYN-ACK, the kernel calls tcp_set_state() to transition SYN_SENT to ESTABLISHED.
-
If the connection times out or is refused, the kernel calls tcp_set_state() to transition SYN_SENT to CLOSE.
We hook tcp_v4_connect on entry to capture the start timestamp, then watch tcp_set_state for the outcome:
The idea, in words: every outbound connection's struct sock * is unique while it's in flight. When tcp_v4_connect is called we stash a record under that key with the current timestamp, pid, and comm. When the kernel later transitions that same socket out of SYN_SENT (either to ESTABLISHED on success or CLOSE on failure), we look the key up, compute now - connect_start_ns, and that's our handshake duration. Outcome falls out of which state we transitioned to. Every event includes the 5-tuple (src/dst IP and port), the smoothed RTT from the kernel's TCP estimator, and the process context.
There's a small kernel-4.14 wrinkle worth mentioning. We have a sister tracker ebpf_tcp_accept that needs to hook tcp_set_state too, for the inbound handshake (SYN_RECV to ESTABLISHED). On 4.14, attaching two separate BPF programs to the same kernel function fails with EBUSY. So we merged the two trackers into one BPF program with a single tcp_set_state kprobe that handles all the relevant state transitions, and routes events to two separate perf buffers (accept_events and connect_events). One probe, two output streams, two ClickHouse tables.
The fix
Two parts. Immediate: redeploy the affected environment so nginx restarted with fresh DNS. Within six hours the stale IP was gone from eBPF and the only destinations we saw were the two live ones, with sub-2ms handshakes. Permanent: stop caching. Switch from upstream-block-with-hostname to variable-in-proxy_pass, with AWS's internal resolver:
When proxy_pass references a variable, nginx re-resolves the hostname per request. The 10-second resolver TTL keeps the cache fresh. The 3-second connect timeout (replacing the 60-second default) means even if a fresh IP ever does go bad mid-flight, we fail fast rather than holding the customer for a minute.
This was the kind of bug where every individual component was working as documented. nginx was caching the way it always does. AWS was rotating IPs the way it always does. The 60-second timeout was the default everywhere. The bug lived in the interaction between three correctly-working systems, and the only way to see it was to watch the network from below.
Story two: the 2-second timer
Webhook ingestion fleet on the prod-python boxes, gthread gunicorn workers behind nginx. We were emitting thousands of customer-facing 502s per hour fleet-wide. nginx's error log was always the same line:
Gunicorn was sending RSTs to nginx mid-request, and nginx was returning 502 to the customer. The question was why.
We pulled ebpf_tcp_loss for the RSTs:
The pattern was clean: src_ip = the gunicorn container IP, dst_ip = nginx side of the docker bridge, each ephemeral src_port appearing two or three times (the kernel's RST retransmit behavior, each unique src_port is one connection that was killed). The RSTs were spread across hundreds of distinct ephemeral ports per hour. Hundreds of distinct keep-alive connections were being killed.
First instinct: workers crashing. No WORKER TIMEOUT in gunicorn logs. No OOM kills in dmesg. No exited containers. Workers were not dying.
Second instinct: workers blocked on a slow downstream, gunicorn killing them. We pulled off-CPU stacks for workers blocked more than 25 seconds. Top stacks were all _queue_SimpleQueue_get_impl, lock_PyThread_acquire_lock, ev_run. Gthread workers waiting idle on the arbiter's internal dispatch queue. Workers were not blocked on downstream calls. They were idle.
Third instinct: the recv buffer was filling and the kernel was forced to RST on close. We checked zero-window events. A small fraction of the RST rate. Not the cause.
We turned to the kernel's own counters on a single box:
TCPAbortOnClose is the counter Linux increments when a process calls close() on a socket that still has unread data in its receive buffer. The kernel converts that close into an RST instead of a FIN, because the data the process is throwing away might have been important. Thousands of those on one box. The number matched the RST rate almost exactly.
So gunicorn was calling close() on connections that had unread bytes from nginx in the recv buffer. The question became: which thread inside gunicorn was doing it, and why.
We attached bpftrace to capture the kernel stack at every RST:
Every single RST had the same kernel stack:
This is the deferred-cleanup path. A process closes a file descriptor; the FD cleanup runs as deferred task work when the process returns to userspace. sock_close finds unread data in the recv buffer and calls tcp_send_active_reset, emit an RST instead of a clean FIN.
The pid/tid filter told us more: every RST came from a process where pid == tid. That's the worker's MainThread, not a request-handling thread. The MainThread is the gthread arbiter inside the worker process. It owns the listening socket, accepts new connections, hands them to thread-pool workers, and manages the idle keep-alive pool.
That was the smoking gun. The MainThread was closing idle keep-alive connections and finding unread bytes in them at the moment of close.
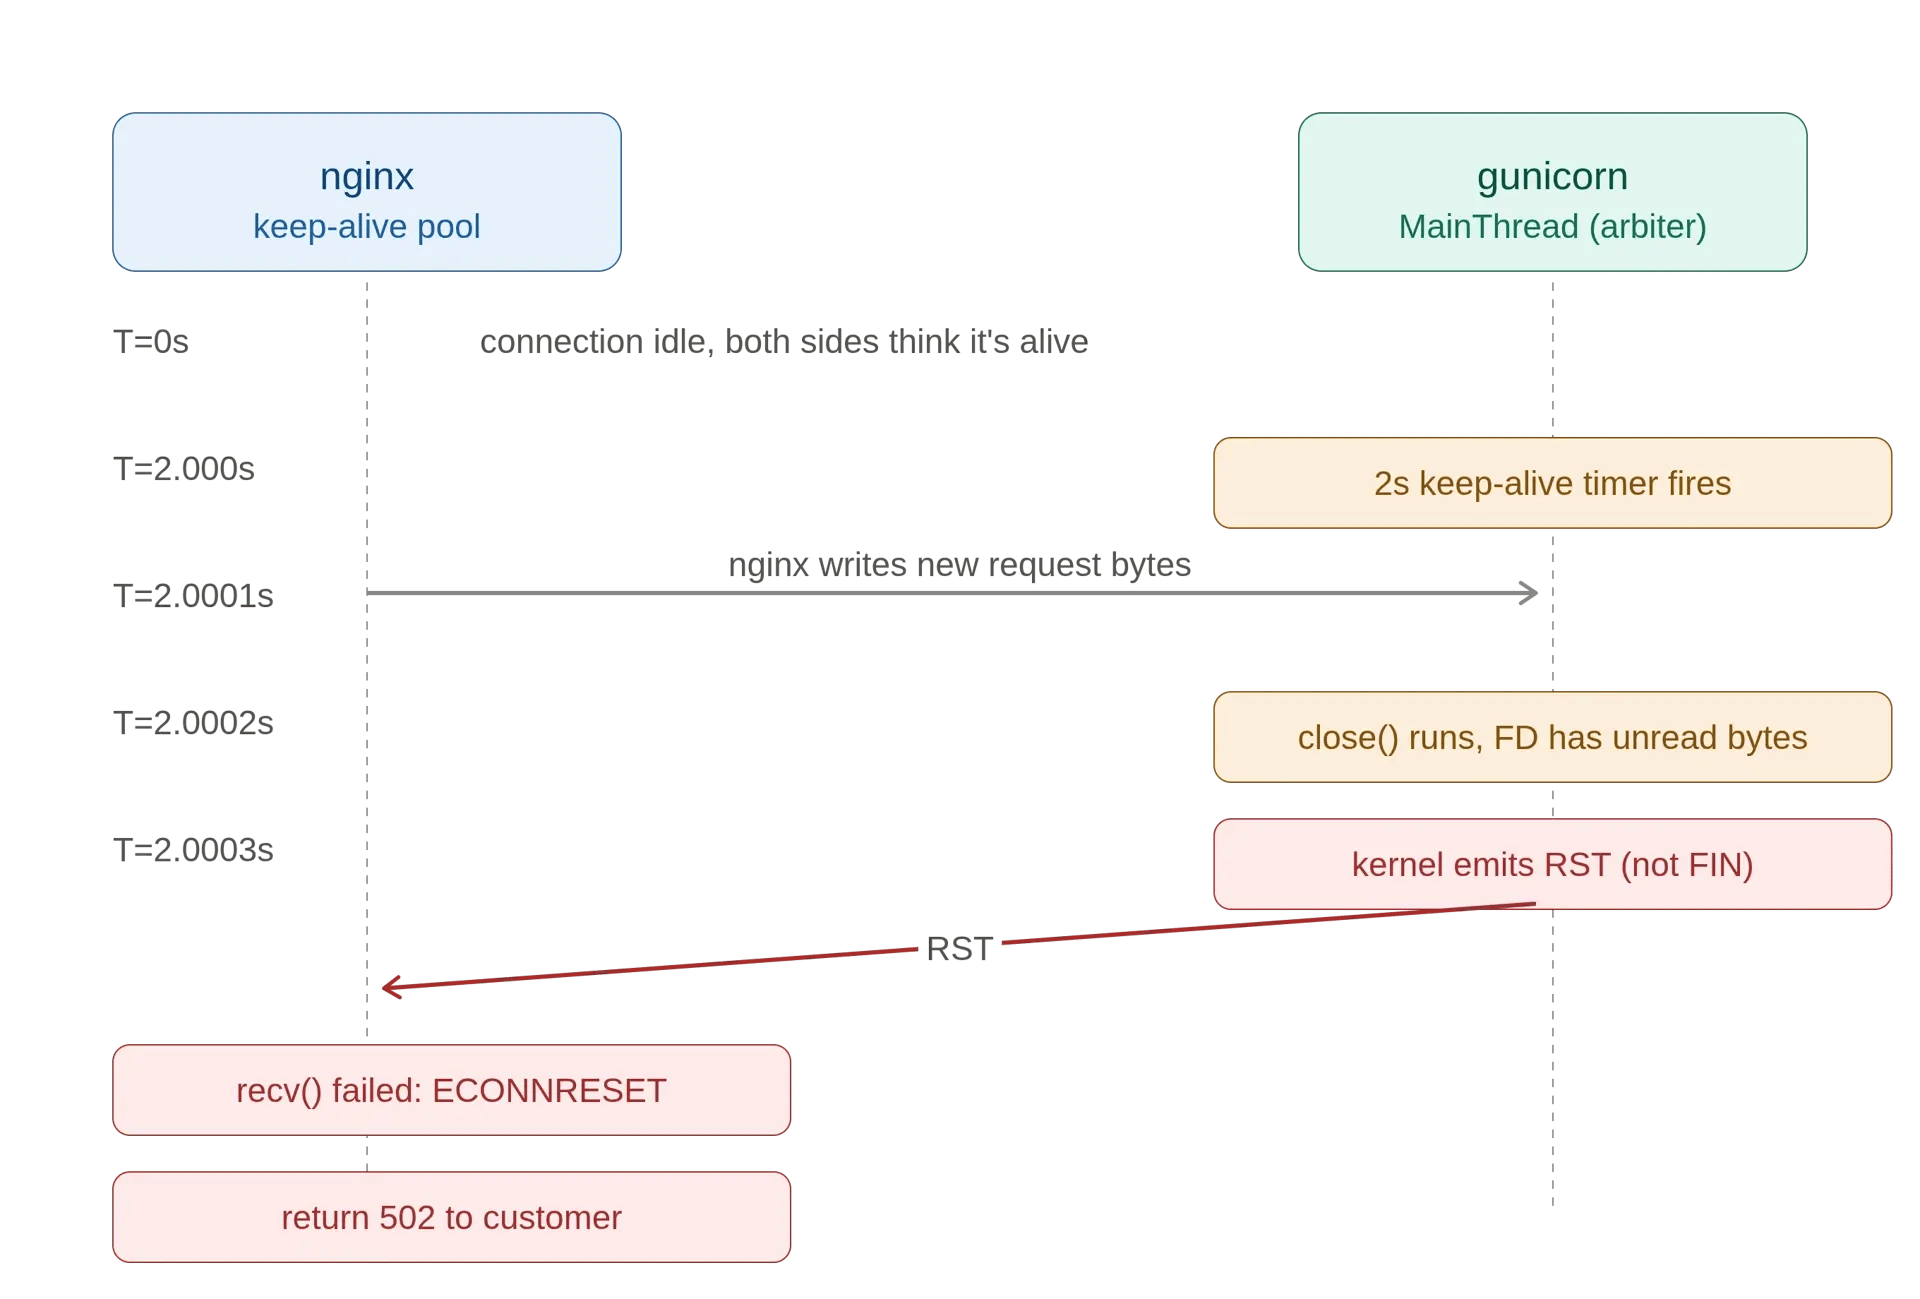
The reason was gunicorn's keep-alive timeout. Default value: two seconds. The MainThread maintains a list of idle keep-alive FDs and closes any that have been idle for more than the configured keepalive setting. With a 2-second default, this fires constantly. The race plays out across microseconds:
-
The MainThread decides an idle FD has timed out, prepares to close it.
-
Meanwhile, nginx's connection pool still considers that FD live. nginx's pool state hasn't been notified of gunicorn's decision to close.
-
nginx writes new request bytes onto the FD.
-
Bytes arrive at gunicorn's recv buffer.
-
The MainThread's close() finally runs. Kernel checks recv buffer, finds bytes, emits RST.
-
nginx, which thinks it just successfully sent a request, receives RST. Returns 502.
The 2-second default is short enough that any modestly busy nginx pool has idle FDs constantly hitting the timer. Any FD that hits the timer at the exact microsecond nginx picks it for a new request gets killed.
Building the loss tracker
The eBPF tracker that exposed this hooks six different kernel functions, one for each kind of bad thing TCP can do, and routes them all into a single perf buffer with an event-type tag:
Attached to:
- tcp_send_active_reset, every RST this host sends
- tcp_reset, every RST this host receives
- tcp_retransmit_skb, every packet retransmission
- tcp_enter_recovery, kernel entered fast recovery (lightweight loss)
- tcp_enter_loss, kernel entered RTO recovery (heavyweight loss)
- tcp_send_probe0, sending a zero-window probe because the peer's recv buffer is full
Every event carries the full 5-tuple plus the kernel's TCP state machine snapshot (srtt, cwnd, total_retrans, lost_out, snd_wnd, rcv_wnd), so a single row can tell you not just "an RST happened" but "an RST happened on a connection in ESTABLISHED state with a 12-packet cwnd, 200ms srtt, and an open send window."
The fix
One line in gunicorn_conf.py:
This makes gunicorn willing to keep idle FDs for 75 seconds. nginx's default upstream idle timeout is 60 seconds, so nginx always closes first. nginx is the responder, it never initiates writes on idle connections, so its close happens when the connection is genuinely quiet. No race. No RST. Customer gets the response.
Post-fix RST count on the same fleet: zero. Sustained over days.
One layer up
After the gunicorn fix removed the worker-side RSTs, a second class of 502 surfaced. The ALB itself was returning 502 to customers without a corresponding nginx error log. Every failed ALB log entry had target_processing_time = 0.001 and target_status_code = "-". ALB connected to nginx in one millisecond, got nothing back, gave up.
We checked eBPF for RSTs on the nginx-to-ALB layer:
Thousands of these per hour at peak. The same race, one layer up.
The setup was symmetric. ALB's idle_timeout was the default 60 seconds; nginx's keepalive_timeout was the default 75 seconds. ALB closed first. ALB then picked the same connection from its target pool for a new client request before its own internal state had fully reflected the close (a load balancer maintains target connection pools across many internal worker processes, with brief inconsistency windows during state propagation). The new request arrived at nginx on a socket that nginx was already in the middle of closing. nginx's kernel emitted RST. ALB caught it and returned 502.
We opened a ticket with AWS support. Their answer: ALB sends FIN on idle timeout, not RST, but if the target then closes ungracefully because of unread data on its end, ALB sees the RST and returns 502 to the customer. Their recommendation: configure target idle timeout longer than ALB's. We bumped ALB to 90 seconds:
Now nginx (75s) closes first. Post-fix ALB-layer RSTs: zero.
The full ladder of fixes:
- gunicorn keepalive: 2s to 75s
- ALB idle_timeout: 60s to 90s
Three connections in the chain (ALB to nginx to gunicorn), and the rule is the same at every layer: the side that doesn't initiate writes should be the side that closes first. Keep-alive timers should grow as you walk further into the system. We had been running them in the opposite order at every hop.
Bonus: retransmits, zero-window, and AWS throttling
The same ebpf_tcp_loss tracker exposes three more failure modes that APM can't see.
Retransmits. Every time the kernel resends a packet because it didn't get an ACK in time, tcp_retransmit_skb fires. A high retransmit rate on a specific dst_ip means either the peer is overloaded or there's loss between you. Both cause the application-level call to look slow, with no error and no obvious cause.
Zero-window stalls. When you write to a peer whose recv buffer is full, the peer advertises a zero window, TCP-level backpressure. Your kernel sends a tcp_send_probe0 to ask "is there room yet?" If the peer stays full, your write() blocks until it drains. From the application's perspective, "the call took longer than usual."
AWS hypervisor throttling. EC2 instances have baseline+burst budgets for bandwidth, packets-per-second, and conntrack entries. When you exceed the baseline and burn through burst credits, the AWS hypervisor silently drops packets at the ENA driver level. The kernel sees retransmits but doesn't know why. The application sees latency spikes that correlate with no internal metric. We have a separate tracker ebpf_host_net_health that polls ethtool -S every 10 seconds for the AWS-specific counters (bw_in_allowance_exceeded, bw_out_allowance_exceeded, pps_allowance_exceeded, conntrack_allowance_exceeded) and emits the deltas, plus a per-process FD utilization snapshot.
The full set of trackers from Part 1 and Part 2, in one stack, gives us coverage from "the request hasn't reached your handler yet" all the way down to "your packets are being dropped at the hypervisor."
The lesson across both parts is the same. APM measures what you instrument. eBPF measures what the kernel sees. The gap between them is exactly where hidden latency lives. In Part 1 the gap was inside the Python runtime: handoff queues, GC pauses, GIL waits. In Part 2 the gap was the network: stale DNS caches, keep-alive race conditions, hypervisor drops. In every case the application thought it was working perfectly. The customer disagreed. The kernel had the truth.
We'll be open-sourcing the entire observability stack, all eight trackers from Part 1 and Part 2, in one repo, in a separate post. We'll link it here once it's published.